What are the Most Popular Browsers Currently in Use?
In 2015 we wrote an article about the most popular browsers currently in use. We quoted statistics from StatCounter and now in 2017 we are updating this information based on the results provided by W3Counter.
The most popular browsers worldwide as at December 2015 were:-
Number One – Chrome
Number Two – Internet Explorer
Number Three – Firefox
Number Four – Safari; and
Number Five – Opera
As you can see from below this has changed as at January 2017. Number one remains Chrome but Safari has now taken the second spot from Internet Explorer. Firefox has remained in third position and Internet Explorer in now in fourth position. Operate is still only a very small share of the market in fifth position.
The most popular browsers worldwide as at January 2017 according to W3Counter are:-
Number One – Chrome with 58.4%
Number Two – Safari with 13.3%
Number Three – Firefox at 9.5%
Number Four – Internet Explorer and Edge only 8.1%
Number Five – Opera with 4.4%
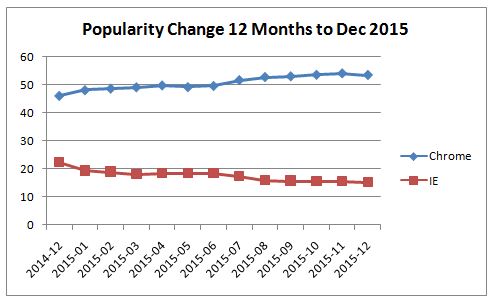
The start of the fall in popularity of Internet Explore was seen clearly back in 2014. The graph below clearly shows the start of that decline and as we now know this just increased through 2016 to now in 2017.
Most Popular Browsers in Australia 2015 and 2017
The information provided by StatCounter for Australia browser usage (excluding mobile) in December 2015 is as follows:-
Number One – Chrome
Number Two – Internet Explorer
Number Three – Safari
Number Four – Firefox; and
Number Five – Edge
Realtime Statistics from Clicky for Australia are as follows:-
Chrome in the number one position.
Internet Explorer just holding onto the number two position.
Safari in the number three position at the heels of IE.
Firefox in the fourth position, very close to Safari.
Microsoft Edge in the fifth position and;
Opera with much less usage in the sixth position.
The Most Popular Browser Over Time in Each Country, 2008 to 2015
This information I have not updated because it will just show a continuation of the trend that was already occurring in 2015.
dadavuz have a wonderful world map which changes to show the dominant browser in each country over time. The map clearly shows how Internet Explorer is replaced by Chrome and which countries adapt to the new browser quickest.
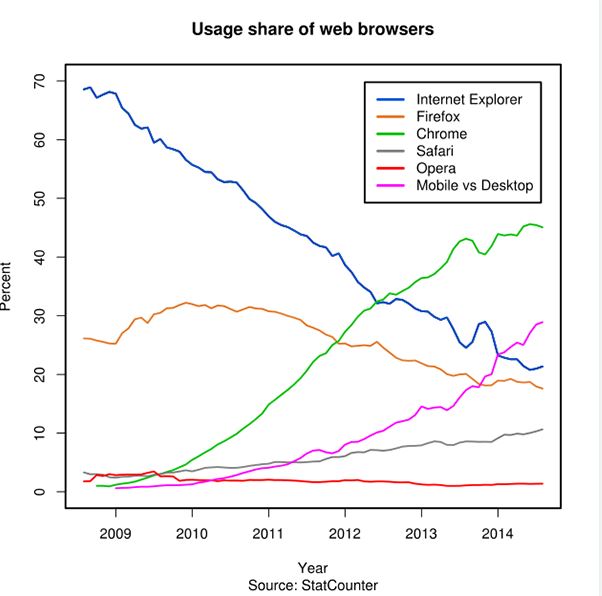
The chart below comes from StatCounter and show how overall usage of the different browsers has changed over time.
Desktop and Mobile Market Share Worldwide 2008 to 2017
StatCounter has some amazing graphs which very clearly show the rapid adoption of mobiles and the declining market share of desktops that is occurring. The use of tables whilst it has grown is not anywhere near as popular as either desktops or mobiles.
This summary of information regarding the popularity of different browsers was written by Affordable Computer Repairs and Service based in Brisbane, Queensland, Australia.